> ## Documentation Index
> Fetch the complete documentation index at: https://docs.qlero.io/llms.txt
> Use this file to discover all available pages before exploring further.
# Analytics
> Explore the sales and royalties behind your statements.
**Analytics** in the Artist Portal shows the sales and royalties behind your published statements. Use it to see which tracks earn the most and where your sales come from.
Viewing Analytics requires Artist Portal access to the payee. If your artist or company name doesn't appear after you sign in, ask your record company's administrator. See [User access and roles](/user-access-and-roles).
## Exploring the data
Analytics has the following tabs:
* **Tracks** shows results for each track.
* **Releases** groups results by release.
* **Artists** groups results by artist.
* **Territories** groups sales by country.
* **Stores** groups sales by the service or retailer, such as Spotify or Apple Music.
For a publishing-only record company, **Works** and **Writers** replace Tracks, Releases, and Artists.
Each tab can be filtered by **Period**, **Territory**, **Sale Type**, **Format Type**, **Source**, **Store**, **Track**, **Release**, or **Contract**. For publishing-only data, **Work** replaces Track and Release. Source is the company supplying the sales data, such as your distributor; Store is where the sale or stream happened.
Use the filters to answer a question about your sales. For example, select a track on **Territories** to see its markets, or a store on **Tracks** to compare your tracks on that service. Selecting several periods combines their results.
Filters stay in place when you switch tabs. Click the cross on a filter to clear that selection. If you see **No stats found for the selected filters**, remove a filter or try another published period.
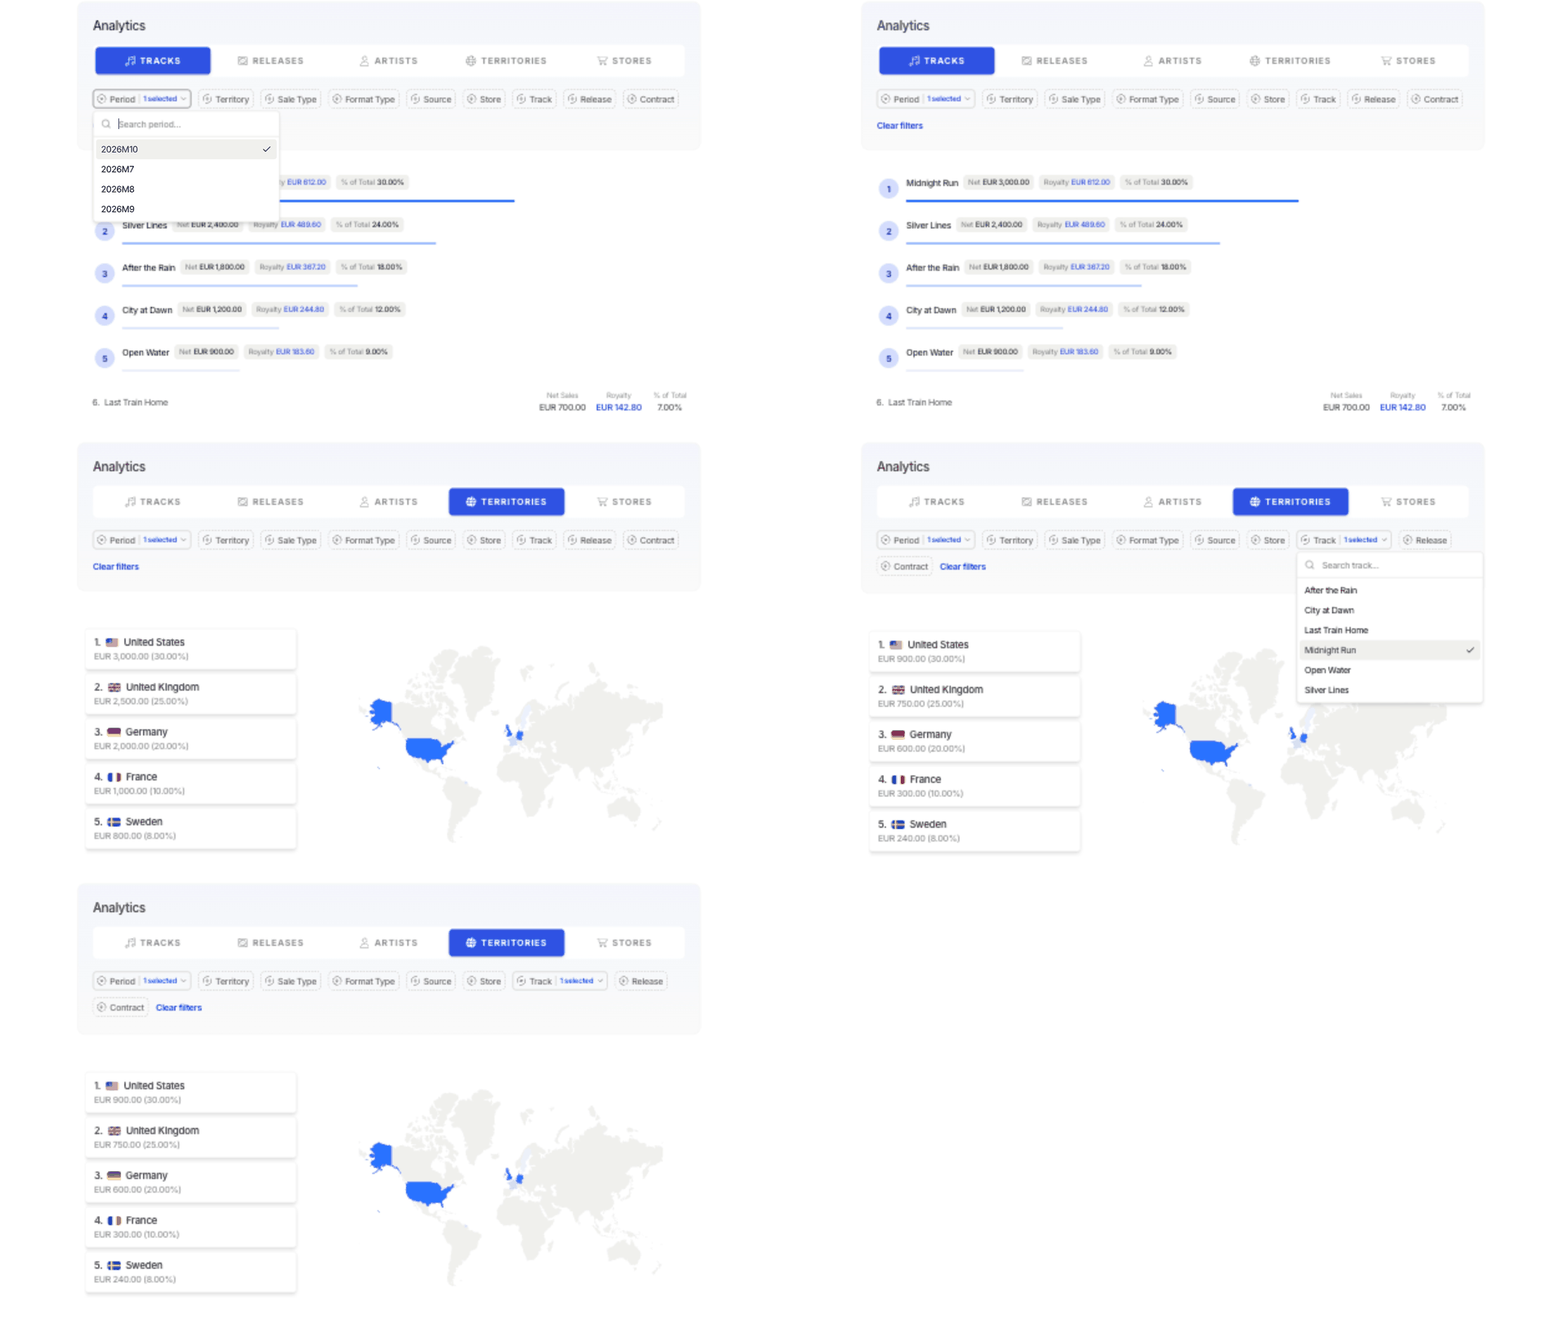
On a larger screen, five or more results bring up a chart for the first five items, or a map on Territories. The map shows net sales and their percentage share. Additional results appear below. Smaller result sets appear as a list. Each tab shows up to 25 results, so narrow the filters when you're looking for a particular track or market.
The demonstration below switches from Tracks to Territories, then shows the country breakdown for *Midnight Run*.
 ## Understand the figures
**Net Sales** (shown as **Net** on the chart) is the sales revenue associated with your contracts before their royalty terms are applied.
**Royalty** is the calculated royalty from those sales. Costs, advances, payments, and other manual transactions affect your balance separately. Use [Statements](/artists/overview/statements) to understand the amount payable.
**% of Total** is each item's share of net sales within the current filters. It isn't your royalty rate. For example, in Nora Lane's October period, *Midnight Run* has EUR 3,000.00 of the EUR 10,000.00 net sales, so its share is 30%. Its calculated royalty is EUR 612.00.
The percentage uses all matching results, including any beyond the 25 shown, so the visible percentages may not add up to 100%.
If an amount has an information icon, click it for currency details. Converted estimates use current exchange rates and don't change your statements or payouts.
## Next steps
Open [Statements](/artists/overview/statements) for the period's balance and downloadable sales detail, or return to the [Dashboard](/artists/overview/dashboard) for your current payable balance.
## Understand the figures
**Net Sales** (shown as **Net** on the chart) is the sales revenue associated with your contracts before their royalty terms are applied.
**Royalty** is the calculated royalty from those sales. Costs, advances, payments, and other manual transactions affect your balance separately. Use [Statements](/artists/overview/statements) to understand the amount payable.
**% of Total** is each item's share of net sales within the current filters. It isn't your royalty rate. For example, in Nora Lane's October period, *Midnight Run* has EUR 3,000.00 of the EUR 10,000.00 net sales, so its share is 30%. Its calculated royalty is EUR 612.00.
The percentage uses all matching results, including any beyond the 25 shown, so the visible percentages may not add up to 100%.
If an amount has an information icon, click it for currency details. Converted estimates use current exchange rates and don't change your statements or payouts.
## Next steps
Open [Statements](/artists/overview/statements) for the period's balance and downloadable sales detail, or return to the [Dashboard](/artists/overview/dashboard) for your current payable balance.